Health care spending falls as a share of GDP

In Health Affairs, CMS Office of the Actuary (OACT) notes that while health care spending grew in 2018, it actually fell as a percentage of the economy.

US health care spending increased 4.6 percent to reach $3.6 trillion in 2018, a faster growth rate than the rate of 4.2 percent in 2017 but the same rate as in 2016. The share of the economy devoted to health care spending declined to 17.7 percent in 2018, compared to 17.9 percent in 2017… Much of the faster spending growth in 2018 was associated not with expenditures for goods and services but instead with the net cost of health insurance (the amount of insurance spending attributed to nonmedical expenses, including administration, taxes, and underwriting gains or losses)

Current health care spending is equal to $11,172 per person.While a decrease in health care spending may seem like a positive, one reason for the decrease was a rise in the number uninsured. The number of uninsured rose by 1 million individuals in 2018 to 30.7 million in 2018; it was the second consecutive year with a rise in unemployment.

Cost increases in hospital and outpatient spending far outpaced spending growth for prescription drugs.

Households and the federal government collectively funded more than half of US health expenditures.

a

Health care spending falls as a share of GDP posted first on http://drugsscreeningpage.blogspot.com/

Urban-Rural Definitions

How do you define if an area is rural? A paper by Bennett et al. (2019) provides some options.

  • Population density. This is one of the simplest approaches and can be applied to any geographic unit. However, it may be problematic for geographic units with a mix of urban and rural sections.
  • MSA-based. The Office of Management and Budget (OMB) defines Metropolitan and Micropolitan Statistical Areas at the county level. However, OMB explicitly says that these definitions are not intended to define rurality.
  • Urban influence codes. Department of Agriculture’s Economic Research Service has created two additional county schemes. Urban Influence Codes divide counties into groups based on their size and adjacency to other county types. Rural-Urban Continuum Codes provide a designation that is also based upon the OMB county designations. Similar to the Urban Influence Codes, these codes are categorized by population size and adjacency to metropolitan areas
  • Frontier and Remote Area Codes. The Economic Research Service has also developed Frontier and Remote Area Codes. These codes are ZIP code based and specific to rural places, unlike many classifications that begin with urban areas and leave rural ones to be defined as a residual. The codes provide four options for categorizing a ZIP code, based on the size of the biggest city or town in that ZIP code and the travel distance to a larger city or town.
  • Other definitions. Examples include the Economic Research Service’s natural amenities scale and County Typology Codes; the Department of Veterans Affairs’ rurality definitions and the Index of Relative Rurality

Many of these definitions are based on different geographical units. Some county, some ZIP code, some Census tracts. However, using counties–while useful because easily linkable to many other data sets–is problematic since county size varies tremendously around the country.

County sizes range from just 13.2 square miles to more than 20,000 square miles (and up
to 147,805 square miles if Alaska boroughs are included), while populations range from eighty eight to more than ten million residents…For example, Maine and Indiana are roughly the same in terms of area, but Maine has sixteen counties while Indiana has ninety-two…St. Louis County, Minnesota, is the largest county east of the Mississippi River, stretching from the Canadian border to the southernmost port on Lake Superior. It contains Duluth— Minnesota’s fourth-largest city, with a population of 86,293—making the county metropolitan by the OMB definition. However, it also contains Voyageurs National Park and the million-acre
Boundary Waters Canoe Area Wilderness.

Urban-Rural Definitions posted first on http://drugsscreeningpage.blogspot.com/

Why is the rent is too damn high?

In many cities–particularly urban areas on the coasts–rent and home prices are much higher than in other areas. Many politicians talk about a housing crisis. Famously, Jimmy McMillan ran for office multiple times under “The Rent is too Damn High” Party.

But why is the rent so high? Today I turn to a classic economics paper from Edward Glaser and Joseph Gyourko. They find that regulations are driving the high cost of housing in many of the more expensive cities in the U.S.

As a whole, our paper concludes that America does not uniformly face a housing affordability crisis. In the majority of places, land costs are low (or at least reasonable) and housing prices are close to (or below) the costs of new construction. In the places where housing is quite expensive, building restrictions appear to have created these high prices.

One implication of this analysis is that the affordable housing debate should be broadened to encompass zoning reform, not just public or subsidized construction programs. Although poor households almost certainly are not consuming the typical unit in areas with extremely high prices, we suspect that most filtering models of housing markets would show that they too would benefit from an increased focus on land-use constraints by affordability advocates

Glaser and Gyourko (2003)

Why is the rent is too damn high? posted first on http://drugsscreeningpage.blogspot.com/

Great Expectations for Health Care: Patients Look for Consumer Experience and Trust in Salesforce’s Latest Research

On the demand side of U.S. health care economics, patients are now payors as health consumers with more financial skin in paying medical bills. As consumers, people have great expectations from the organizations on the supply side of health care — providers (hospitals and doctors), health insurance plans, pharma and medical device companies.

But as payors, health consumers face challenges in getting care, so great expectations are met with frustration and eroding trust with the system, according to the latest Connected Healthcare Consumer report from Salesforce published today as the company announced expansion of their health cloud capabilities.

This is a global study, conducted among health citizens from North America, Latin America, Europe and the Asia Pacific region. Salesforce conducted interviews with nearly 6,000 people for the report, including 2,002 U.S. adults in July and August 2019.

Some of the key U.S. findings were that,

  • 83% of people want health web portals personalized to them
  • 55% would value live chat and instant message for medical tasks
  • 70% would be interested in accessing a live health coach
  • 68% would be interested in a mobile app to enable that health coaching
  • 53% would be interested in a voice assistant for health care.

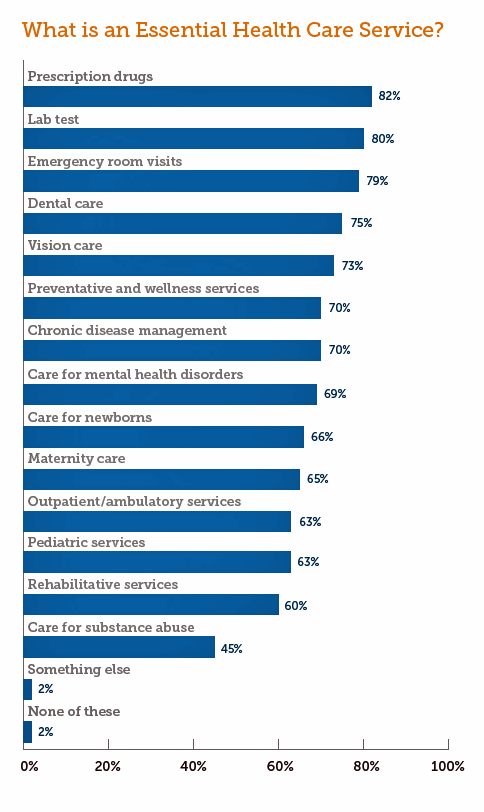
Compare the findings in the first chart above with the second chart here on consumers’ expectations from the healthcare system.

Patients as health consumers face challenges paying for care, managing mental health, finding health services and taking time off work to access them, caregiving, and in transportation for care along with personal mobility issues.

A few key data points illustrate the magnitude of the frustration: 50% of U.S. consumers told Salesforce that life circumstances have caused them to miss a medical appointment; 40% have challenges finding health services nearby; and, 44% of people said taking time off of work to get care is challenging.

Frustration across this continuum of challenges results in the finding that about 1 in 2 people say health care organizations are more focused on the industry/business than on peoples’ needs.

But experience is as important as products for 8 in 10 people.

On that personalization, tactical level, most of the healthcare suppliers don’t provide relevant communications to patients: the top performer here was providers, with 49% of consumers saying hospitals’ and clinicians’ communications were personally relevant. Most patients-as-consumers said it would be important for providers to provide good customer support, know details of “my record” once identified, follow up on progress and outcomes, provide easy access to my health records, send communications relevant to my needs, and proactively communicate with me.

40% of consumers found insurers’ communications to be relevant to “me.” Nearly all consumers look to insurance companies to provide easy-to-understand explanations of benefits, provide details cost and copayment information, easy access to health records, follow up to ensure issues were resolved, make it easy to submit claims, and know my details.

Only 33% of consumers said communications from pharma companies were relevant “to me.” But patients here, too, want pharma to build direct relationships with them, according to Salesforce’s analysis. The majority of patients seek good customer support from pharma, education on how to derive the most value from my medications, advice and resources to ensure medication adherence, relevant offers and rebates, and follow up on progress and outcomes.

Americans cite health care (69 percent) and mass shootings (71 percent) as a significant source of stress.

Health Populi’s Hot Points:  The top challenges in patients seeking care noted in the first chart related to paying for treatment, following by mental and emotional well-being.

This third chart comes from the latest annual Stress in America survey done by the American Psychological Association, published today on U.S. Election Day 2019.

Note the sobering symmetric findings that 7 in 10 Americans report that both mass shootings and health care are “significant sources of stress.”

The cost of health care was the most commonly cited source of health care stress (among 64%).

“There is a lot of uncertainty in our world right now — from mass shootings to climate change…more Americans are saying these issues are causing them stress,” APA’s CEO Arthur C. Evans Jr., said in the study’s press release. “Over time, prolonged feelings of anxiety and stress can affect our overall physical and mental health.”

The survey was conducted by The Harris Poll for the APA in August and September 2019 among 3,617 U.S. adults.

The health care industry can do a better job supporting patients-as-health-consumers when it comes to managing the stress of the cost of health care, the Salesforce research suggests. This last bar chart provides some granular recommendations for healthcare industry suppliers, whether providers or pharma companies or health plans, to extend tools and information on cost, access, self-care and risk management that’s personally relevant and clear.

At least eight in ten consumers would like to see better communication across all of these cost-access-advice issues.

That is for the immediate-near term under the fragmented, high-cost health care system that currently challenge American health citizens.

Today as Election Day, I recall my post published yesterday here in Health Populi on U.S. voters’ perspectives on health care reform looking toward Election Day 2020. With health care reform a top issue driving people to polls in the 2018 mid-term elections, I am certain the issue will continue to light fires under millions of patients’ political activism over the next 364 days.

In the meantime, more understandable EOBs, streamlined patient access programs for innovative drugs and devices, Uber and Lyft rides to medical appointments, food pharmacies and greater self-care through switched over-the-counter medicines must help people muddle through their individual health consumer journeys.

The post Great Expectations for Health Care: Patients Look for Consumer Experience and Trust in Salesforce’s Latest Research appeared first on HealthPopuli.com.

Great Expectations for Health Care: Patients Look for Consumer Experience and Trust in Salesforce’s Latest Research posted first on http://drugsscreeningpage.blogspot.com/

Why are organ donation rates so high in Spain?

As you can guess from the title of this post, Spain leads the world in rates of organ donation. More recent figures back this up.

Figures published for 2017 reveal that 2,183 people in Spain became organ donors last year after they died. That’s 46.9 per million people in the population (pmp) – a standard way of measuring the rate of donation in a country.
Spain’s closest contender is Croatia, with 38.6 pmp (2016). It has maintained its position as the clear leader for the past 26 years.

The Independent

Why is this the case?

PBS Newshour

There are a number of reasons. The most well known is that Spain relies on the “opt-out” system.

When attempting to explain Spain’s success, it’s the “opt-out” (or presumed consent) system for deceased organ donation that is perhaps cited more often than anything else. Opt-out means that a patient is presumed to consent to organ donation even if they have never registered as a donor…
Despite Spain having a nominal presumed consent system, in practice coordinators do all they can to find out whether a patient is happy to donate before they die, and also whether their relatives or loved ones are comfortable with this.

The Independent

While the opt-out system was created in 1979, things really took off only after Spain implemented the administrative systems necessary to take advantage of this rule. Specifically, i6mn 1989, Spain’s Ministry of Health created the Organización Nacional de Trasplantes (ONT). This agency was put in charge the coordination and oversight of donation and transplantation activities across Spain. ONT was succressful; donations rose from 15 per million to 30 per million in under 10 years.

Another factor is that Spain prioritizes organ transplants from the elderly.

While only seven percent of organ donors are over the age of 65 years in the United States, ten percent of organ donors in Spain are over the age of 80.

EurekAlert

While there are many other factors to consider, organ donation is certainly an area where the US could learn something from the Spanish.

Why are organ donation rates so high in Spain? posted first on http://drugsscreeningpage.blogspot.com/

Most Consumers Are Interested in Using a Voice Assistant for Some Type of Health Care

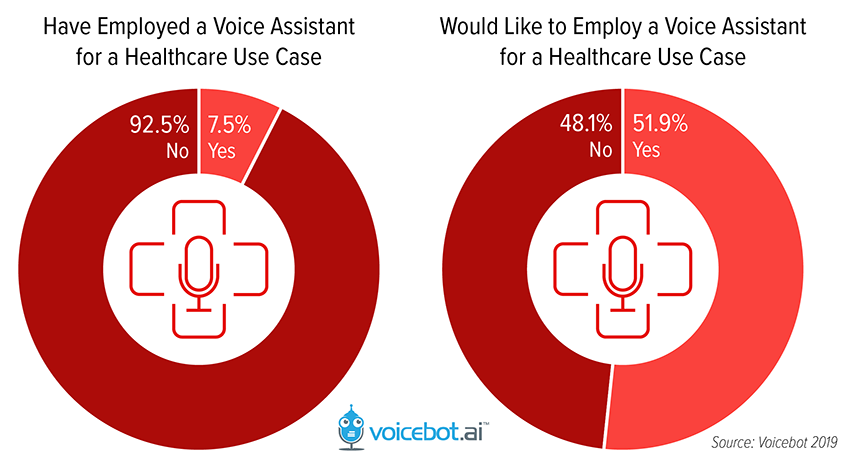
While 75 million people in the U.S. have a smart people at home, only 1 in 13 Americans have used a voice assistant like Alexa or Google Assistant for health care.

But over one-half of consumers would like to access a voice assistant for some aspect of their health care, according to a study from Orbita and Voicebot, Voice Assistant Consumer Adoption in Healthcare.

The study polled 1,004 U.S. adults 18 and over in September 2019.

In 2019, few health care providers have adopted voice assistants into their workflows. The report calls out one big barrier to early adoption especially among hospitals and physicians: concerns about privacy and HIPAA compliance.


The top interest health care categories for voice assistants are asking about illness symptoms above all, cited by one-third of consumers. This was followed by finding a hospital, asking about medication information, seeking nutrition information, scheduling a visit to a doctor or hospital, connecting to a digital health device (like a Fitbit tracker or blood glucometer), finding a clinician, and researching treatment options.

Note that voice-tech for healthcare isn’t just something in which younger people are keen to use. This study found that nearly one-half of people over 60 years of age would be interested in accessing voice assistants for healthcare.

The study also asked consumers what devices people would be comfortable using for voice-tech in health care.

More popular than a smart speaker, a laptop or personal computer took first place in the device consumers would like to use as the medium for voice-assistance in health care. A fitness device or car-based assistant took the next place, followed by a smartwatch, smart TV, smart device (like a weight scale), or smart earbuds each of which garnered less than 8% of consumers interested in those form factors.

For more on the connected car as a third-space for health care, see my post from CES 2017, Your car as a mobile health platform.

Health Populi’s Hot Points:  The issue of privacy and voice assistants began to reach mass media in 2018 as smart speakers became popular holiday gifts; here’s a cautionary explanation from the University of Michigan published in November 2018 just-in-time for last year’s holiday shopping season.

The last graph illustrates consumers’ concerns about privacy and voice assistants: nearly one-half of people were moderately or very concerned about privacy and smart speakers as of September 2019. Fewer than one-in five people were not concerned at all by the prospect of voice assistant privacy breaches.

The use cases for health care must wrestle with HIPAA and other privacy laws that may be relevant for a particular medical situation or patient population. In January 2020, California will usher in the state’s privacy law, the CCPA, and thus will begin a new-and-improved era expanding consumers’ privacy rights across all types of personal data, including and beyond personal health information.

In the meantime, Amazon announced several HIPAA-compliant Alexa skills in April 2019 that will be just the beginning of this fast-growing phenomenon for voice assistants in health care. If smart speakers bring health consumers fair value (based on peoples’ definition of “value”) in return for the sharing of personal health information, word-of-mouth – literally – will expand use of these tools.

The post Most Consumers Are Interested in Using a Voice Assistant for Some Type of Health Care appeared first on HealthPopuli.com.

Most Consumers Are Interested in Using a Voice Assistant for Some Type of Health Care posted first on http://drugsscreeningpage.blogspot.com/

Making Life-Saving Medical Treatments More Affordable

That is the title of an article by my colleagues Anupam B. Jena, Rebecca Kee, James R. Baumgardner and others in an article published this month in Harvard Business Review. While the FDA has created “Breakthrough” designations for drug approvals, getting innovative, but high-priced drugs to patients is often delayed by hurdles in coverage and reimbursement faced by payers. The article notes four key challenges:

  • Fee-for-service reimbursement. Because many curative therapies–like CAR-T and new treatments for hepatitis C virus–have high up-front cost, payers may wish to delay paying, especially as these treatments will eventually become generic.
  • Lack of long-term clinical data. Clinical trials are typically of short duration. For treatments providing cures, however, long-term data is needed to verify this claim. Thus, payers may be hesitant to pay high up-front costs if long-term real-world effectiveness is unknown.
  • Insurance churn. In the private health insurance market, individuals often change health plans. Thus, a health plan paying for an expensive curative treatment may be stuck footing the bill, while another health plan may reap the benefits when the patient switches to their plan.
  • Lack of government flexibility. When innovative treatments are administered as part of an inpatient stay, for instance, things become more complicated. A new MS-DRG inpatient code may be needed to capture the added cost of the new treatment. Other alternatives–such as add-on payments–often take time to go through regulatory processes. For Medicare Advantage plans, bids need to be submitted 6 months before a plan year starts. Thus, new therapies may increase expected cost and plans may be reluctant to cover new expensive treatments.

What is the solution? The article gives some options such as outcomes-based payments, installment payments, risk pooling, and subscription payments. Do read the whole thing to learn more about these solutions.

Making Life-Saving Medical Treatments More Affordable posted first on http://drugsscreeningpage.blogspot.com/

A Health Future with Lyft and Uber as Patient Data Stewards: Rock Health’s 2019 Consumer Survey

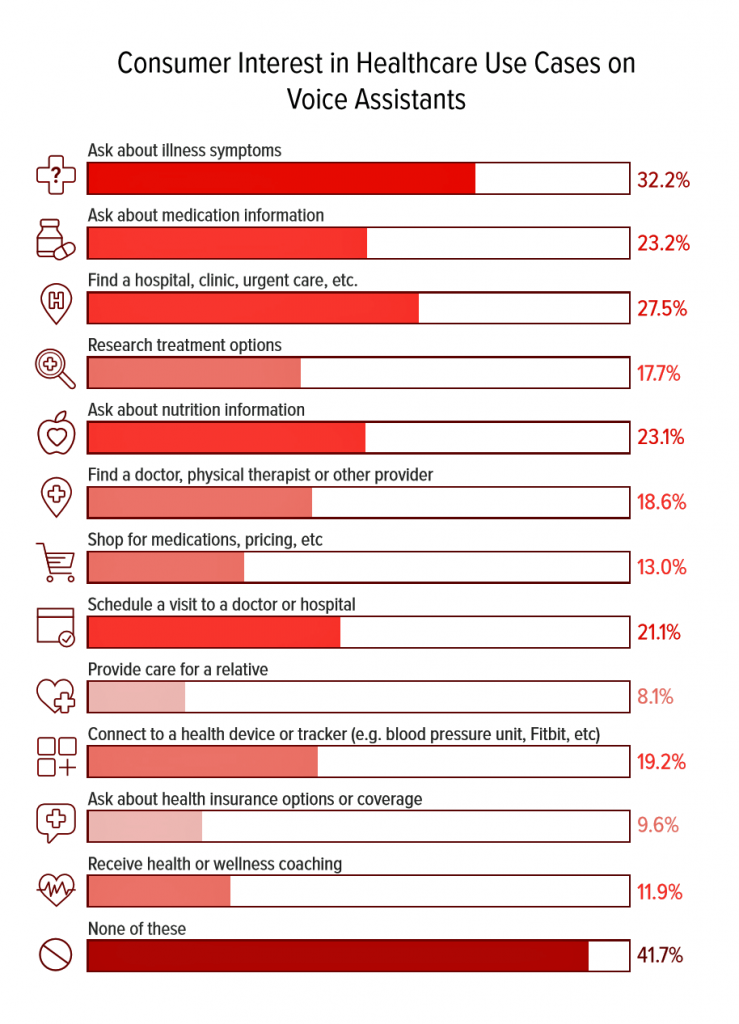
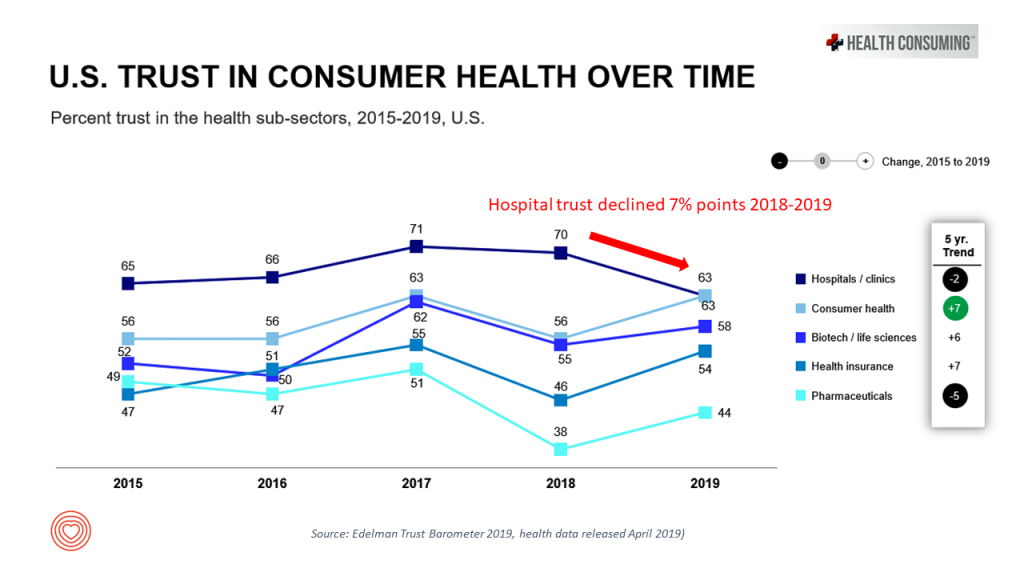
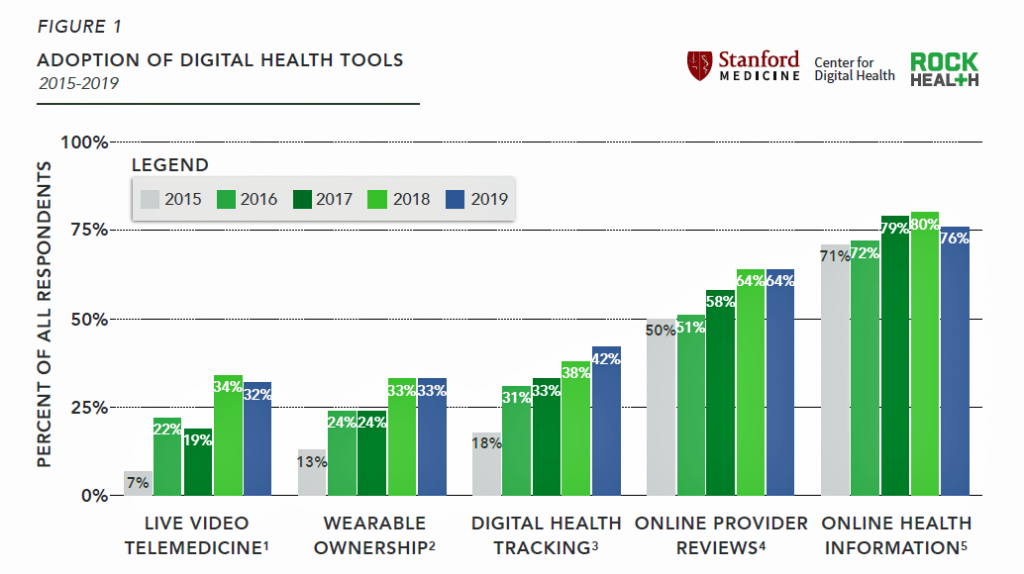
Patients searching online for health information and health care provider reviews is mainstream in 2019.  Digital health tracking is now adopted by 4 in 10 U.S. consumers.

Rock Health’s Digital Health Consumer Adoption Report for 2019 was developed in collaboration with the Stanford Medicine Center for Digital Health. Rock Health’s research has tracked peoples’ use of telemedicine, wearable technology, digital health tracking, and online health information since 2015, and the results this round show relative flattening of adoption across these various tools.

Rock Health’s top-line findings were that:

  1. Patient-generated health data creates opportunity, and potential challenges
  2. Online health information is re-shaping the relationship between patients and clinicians
  3. U.S. consumers’ willingness to share their data depends on whom they are sharing it with.

Start with tracking: nearly 80% of people tracked at least one health metric in 2019, but nearly one-half of that tracking was done in an analog, not digital way. This was a deja vu data point for me, thinking back to Susannah Fox’s study at the Pew Research Group back in 2013 which learned that most people tracked health data “in their heads.”

How not-so-far we have come, right?

What do health trackers track, then? The second chart (Figure 3 in Rock Health’s report) illustrates the most popular consumer-tracked health metrics by health conditions of obesity, diabetes, heart disease and hypertension.

Note that the darkest green tone identifies the data for tracking via digital methods. Overall, the most common digitally-tracked metric is blood pressure, followed by weight.

The most digitized tracking was for blood sugar among people managing diabetes, at 29% of patients, followed by 24% of people tracking blood pressure digitally among people with hypertension as well as heart disease, and 23% of people dealing with obesity tracking weight digitally.

Only about 20% of people who tracked a health metric shared that data with a health care provider, Rock Health learned.

Among consumers willing to share health information, the most trusted touch point is “my physician,” with whom 86% of people said they’d share in 2017 but dropping to 73% in 2019. Second in sharing-line were “my health insurance company” and “my pharmacy” for just over one-half of consumers, a percentage which stayed fairly flat between 2017 and 2019.

The proportion of people willing to share data with research institutions fell by 44% to 34% in the two years, and with health tech companies, flat at 23% between 2018-2019.

Only one in five consumers would be willing to share their data directly with pharma companies, to Rock Health’s third point about willingness-to-share-with-whom.


Health Populi’s Hot Points:  The third chart shown here, Figure 9 from the Rock Health report, presents data on the tech companies with whom U.S. consumers would be most willing to share their health data.

This information compelled me to return to the previous responses to this question in Rock Health’s surveys starting back in the 2015 study into digital health consumer adoption.

In 2015, Google was still the top company with whom people would share data — at a percent of 10.2% of total consumers, followed by:

  • 9.6% willing to share with Microsoft
  • 9.2% with Apple
  • 8.3% with Samsung, and
  • 5.4% with Facebook.

You will quickly say, “ah! The proportion of consumers willing to share personal health information with pure-play tech companies has grown exponentially!”

True — yet the proportions have dropped between 2018 and 2019 as follows:

  • Google is down 4 percentage points over the past year
  • Microsoft down 4 percentage points
  • Amazon down 8 points
  • Apple down 7 points
  • Samsung down 4 points
  • Facebook down 4 points.

And this year, Rock Health added in Uber and Lyft, with whom 22% and 16% of consumers would share health data, respectively.

We see the continued evolution of health-data ecosystems, as well as the re-definitions of what a “tech company” is vis-a-vis a “health-tech company.” Clearly, with the rumors this week that Google may be looking to acquire Fitbit, Google Health would continue to grow its data mine massively through that transaction. And, as Cerner announced its collaboration with Uber Health this week, we see a health IT company expanding beyond what an EHR could be.

The post A Health Future with Lyft and Uber as Patient Data Stewards: Rock Health’s 2019 Consumer Survey appeared first on HealthPopuli.com.

A Health Future with Lyft and Uber as Patient Data Stewards: Rock Health’s 2019 Consumer Survey posted first on http://drugsscreeningpage.blogspot.com/

Will Consumers Cross the Cost-and-Trust Chasm Between Prescription Drugs and Hospitals?

People in the U.S. rank prescription drugs, lab tests, emergency room visits, dental and vision care, preventive services, chronic disease management and mental health care as the “most essential” health care services, according to the 2019 Survey of America’s Patients conducted by The Physicians Foundation.

When asked what factors contribute to rising health care costs in America, most consumers cite the cost of prescription drugs.

Taken together, these two data points demonstrate the potent political import of prescription drug prices as the U.S. approaches the 2020 Presidential election.

The Physicians Foundation surveyed 2,001 U.S. adults between 27 and 75 years of age in September 2019 who had seen a physician at least once in the past year. I covered this study in yesterday’s Health Populi, focusing on consumers’ health care cost concerns and growing awareness of the impact of social determinants of health for patients’ own medical care and that of their communities’.

We learned in yesterday’s post that the vast majority of Americans cite costs as the top factor jeopardizing patient care in the U.S. 84% of Americans told the Foundation that they were concerned about how much health care costs will affect them in the future, with 42% of patients saying they couldn’t afford to pay over $500 for an unexpected medical bill.

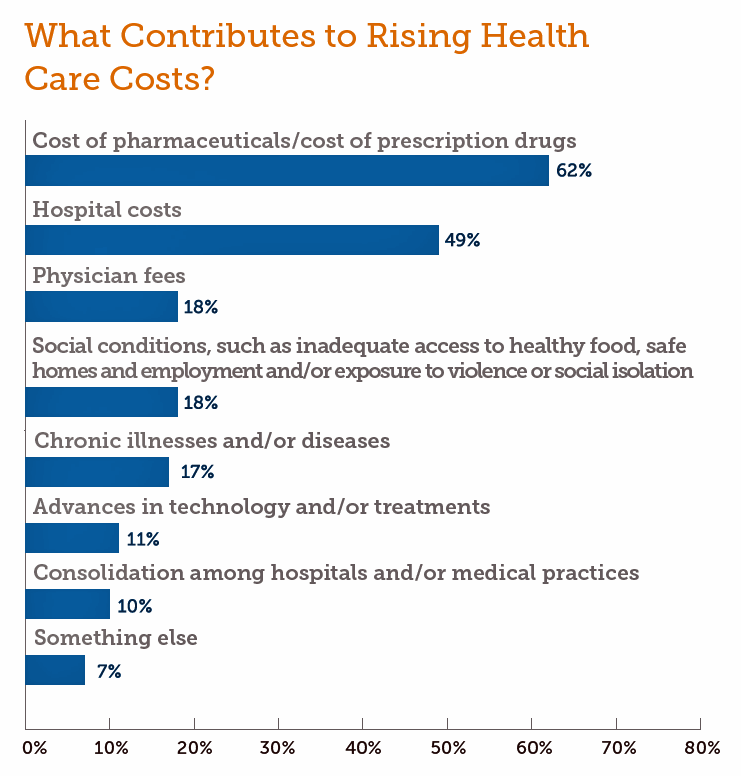
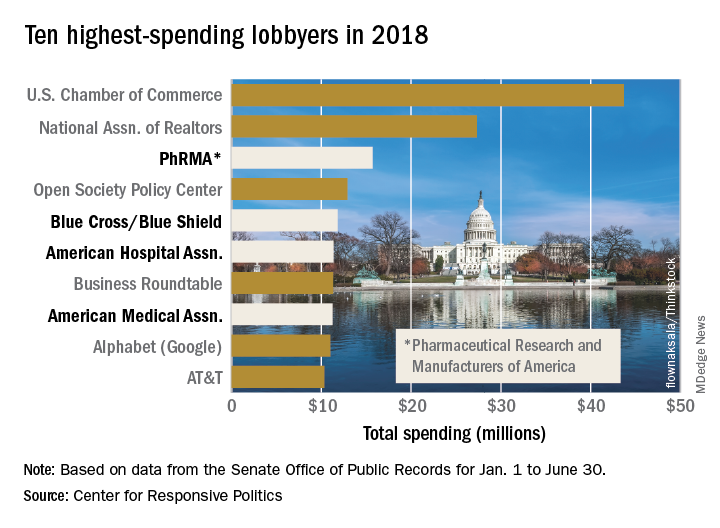
Top of mind for Americans in 2019 is the price of prescription drugs, according to 62% of people. Hospital costs contribute to rising medical costs to 49% of health consumers. Physician fees are cited as cost-contributing by only 18% of patients.

Exacerbating U.S. patients’ negative views of the pharmaceutical industry in this study was the opioid epidemic. Over one-half of Americans blame pharmaceutical companies as most responsible for the opioid crisis, followed by physicians, whom 39% of health consumers blame, and patients, whom 38% of people blame.

Health Populi’s Hot Points:  There’s an ongoing dialogue (if we are to be the most sanguine optimist), debate (if we sit in the middle of the ping-pong table), or wrestling match (if we go full body slam) when it comes to what factors continue to drive up health care costs in the U.S.

For perspective, let’s examine the dollars spent for lobbying by each of the largest health care stakeholder associations, numbers brought to us by the Center for Responsive Politics.

The bar chart shows that PhRMA (the advocacy group for the pharmaceutical industry), Blue Cross & Blue Shield Association, the American Hospital Association, and the American Medical Association (representing physicians) were four of the ten highest spending lobbyers in 2018.

There’s an ongoing “debate” (to stay middle of the road in describing the many sides of the question) regarding “who” is to blame for rising medical spending in America.

A recent study on politics and health care spending in the U.S. published by the National Bureau of Economic Research found a close link between electoral politics and Medicare: that is, between legislative processes in the U.S. Congress and healthcare spending.

NPR covered this and other research in a piece on how non-profit hospitals could be driving up health care spending. In the words of NPR, “Hospitals are the largest individual contributor to health care costs in the U.S….over a trillion dollars a year,” which is about one-third of national health spending.

“The cost of hospital services has been exploding. Between 2007 and 2014, hospital prices grew 42%. The irony is most hospitals are ‘nonprofit,’ a status that makes them tax exempt….yet it’s clear nonprofit hospitals are very profitable,” the NPR story continued.

It’s important to note that this year’s Edelman Trust Barometer found that Americans’ trust in the hospital sector eroded from 2018 to 2019, while over that year trust in the pharma industry increased.

Will consumers cross that cost-and-trust chasm and express similar outrage with the hospital sector as they’ve shown for a decade vis-a-vis Big Pharma?

If surprise medical bills, out-of-network hassles, and waiting times for services persist, we may see this happen as patients-as-payors exercise their consumer muscles. And that also includes how people will vote at the polls in 2020.

The post Will Consumers Cross the Cost-and-Trust Chasm Between Prescription Drugs and Hospitals? appeared first on HealthPopuli.com.

Will Consumers Cross the Cost-and-Trust Chasm Between Prescription Drugs and Hospitals? posted first on http://drugsscreeningpage.blogspot.com/